|
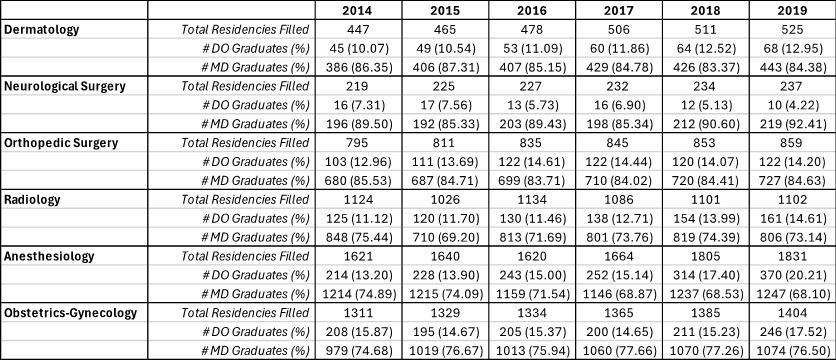
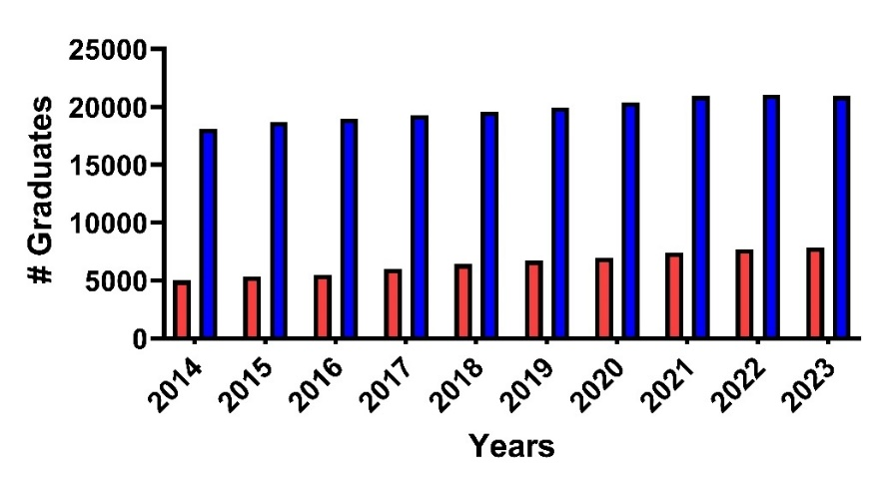
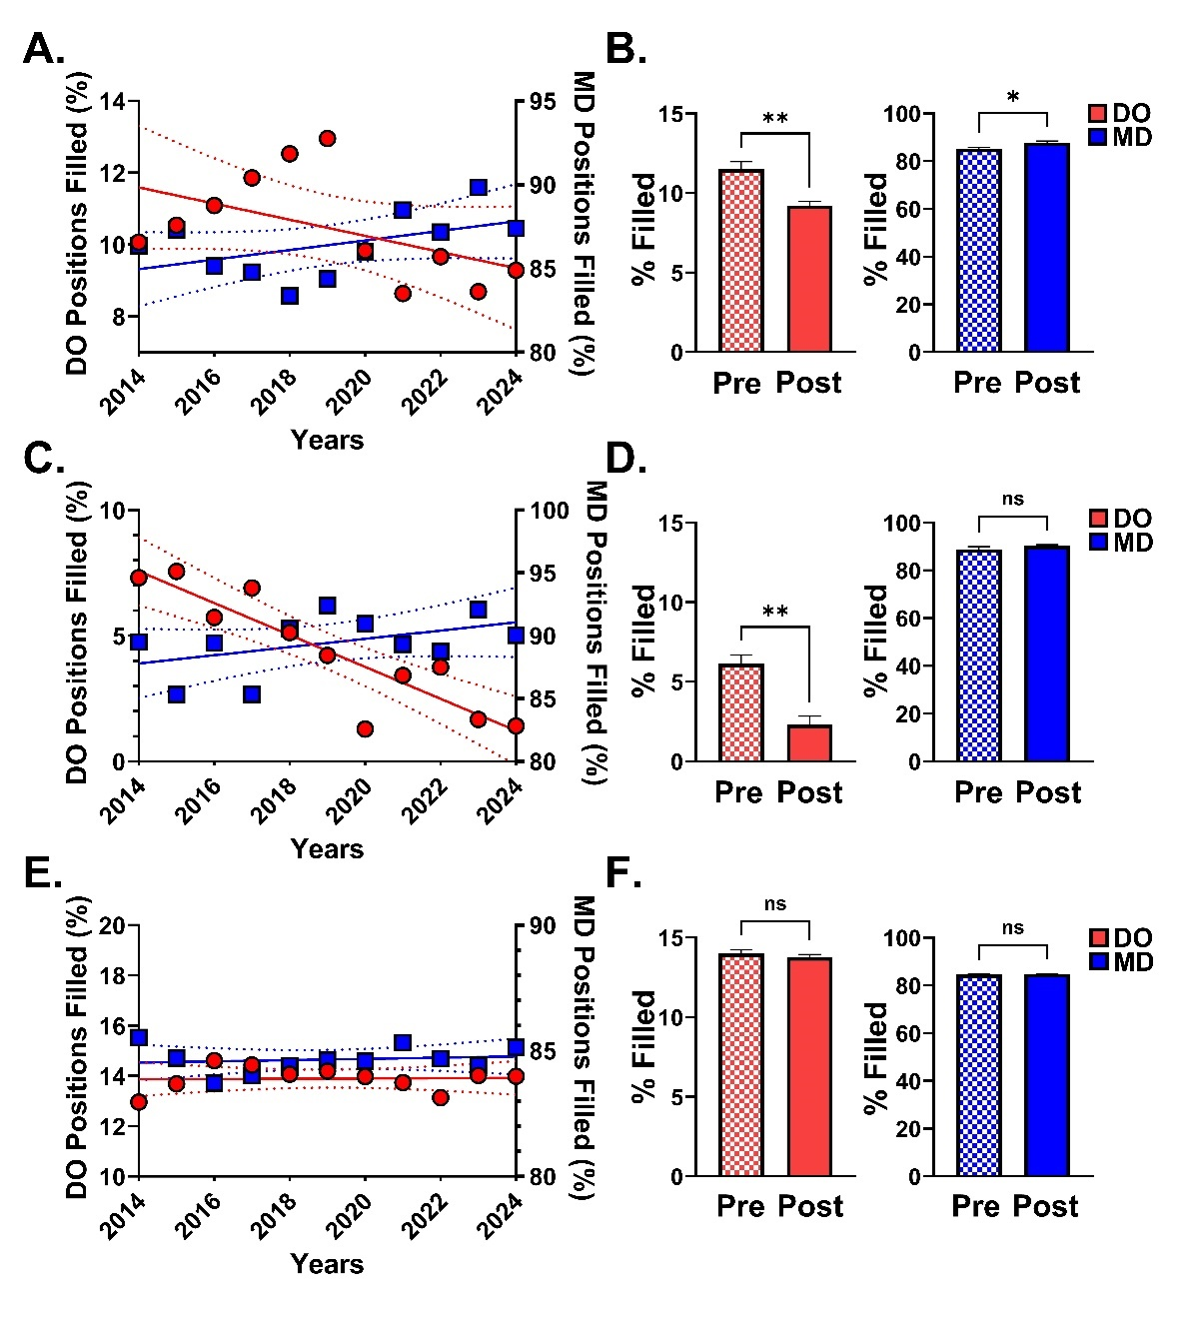
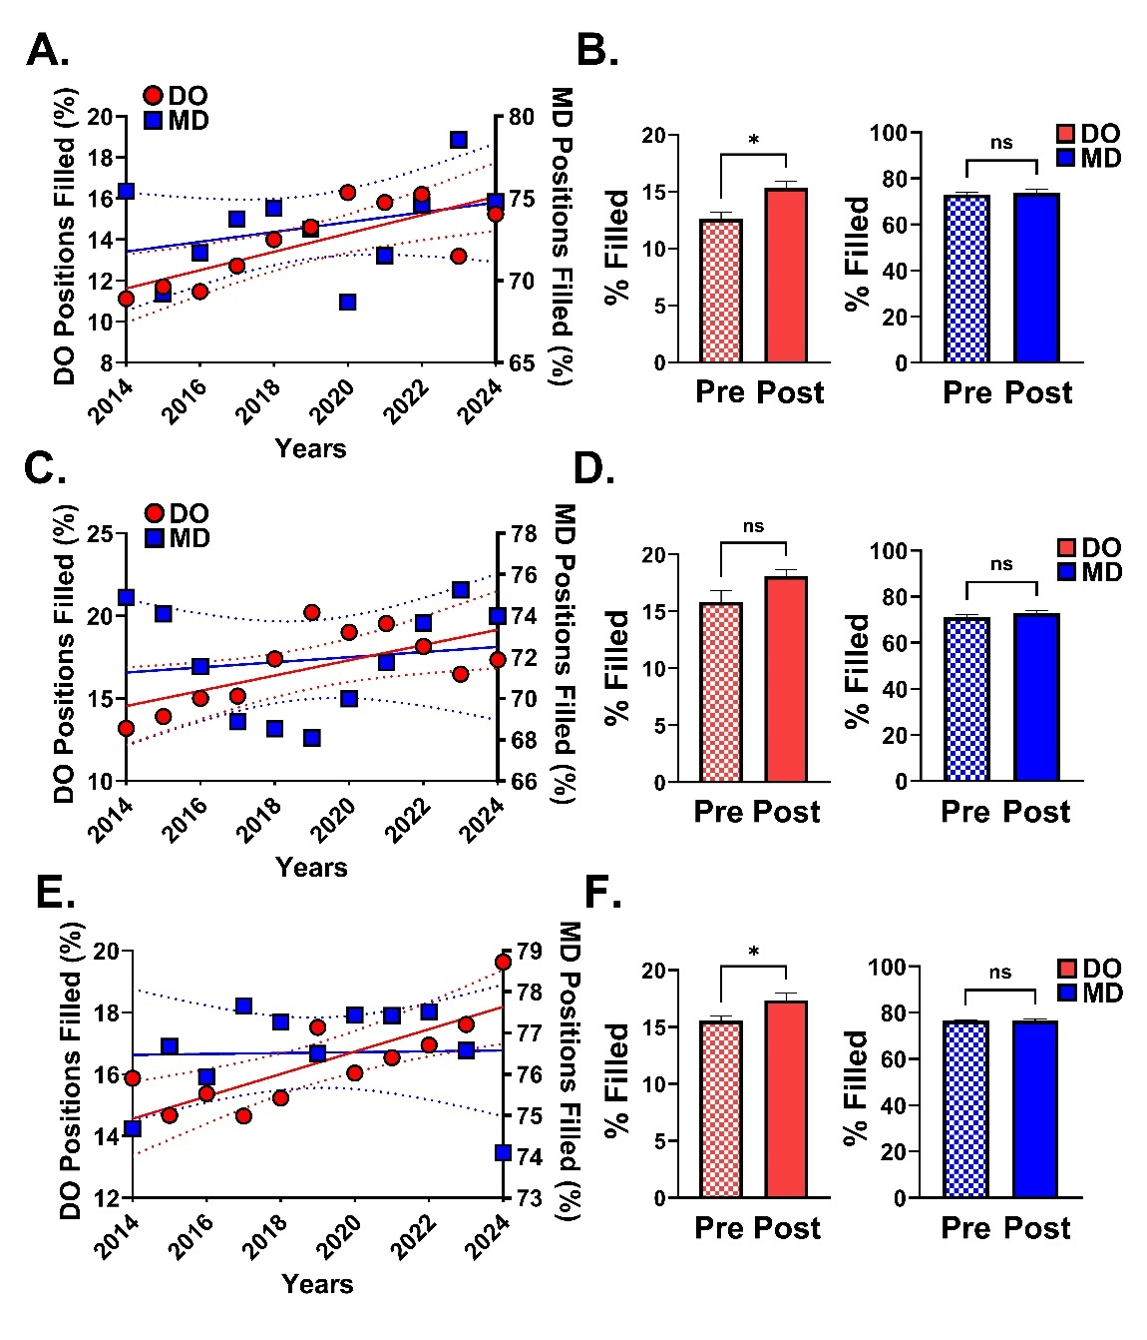
Trends and Outcomes in Residency Matches: Assessing the Post-Merger Landscape for DO and MD Graduates June 2026 | Vol. 70, No. 2 Abstract Context: The effects of the American Osteopathic Association (AOA) and Accreditation Council for Graduate Medical Education (ACGME) merger on match rates for osteopathic (DO) graduates have yet to be fully elucidated. The goal of the merger was to increase equity between DO and allopathic (MD) graduates. Subsequent to the merger, concerns remain regarding parity among DO and MD graduates. Objectives: To examine trends in residency placements, we analyzed pre- and post-merger match rates for dermatology, neurological surgery, orthopedic surgery, radiology, anesthesiology, and obstetrics-gynecology (OB/GYN) residencies for both DO and MD graduates. Methods: Data were compiled from the National Resident Matching Program (NRMP) from 2014–2024 and the National Matching Service (NMS) for 2014–2019. Additionally, yearly totals of osteopathic and allopathic graduates from the American Association of Colleges of Osteopathic Medicine (AACOM) and the Association of American Medical Colleges (AAMC) were collected. All data were analyzed by linear regression analysis, Spearman’s correlation, and Mann-Whitney U tests using Prism v10. Results: Correlation analyses of the number of DO and MD filled competitive residency positions for dermatology, neurosurgery, and orthopedic surgery were performed. With the exception of orthopedic surgery (Regression: y = 0.005x + 3.4; r2 = 0.001; Spearman’s: r = -0.009, n = 11 pairs, p = 1.0), the percentage of DOs filling traditionally competitive residency positions was negatively correlated over the last eleven years (Dermatology: Regression: y = -0.2x + 464.0; r2 = 0.3; Spearman’s: r = -0.6, n = 11 pairs, p < 0.05; Neurosurgery: Regression: y = -0.6x + 1286; r2 = 0.8; Spearman’s: r = -0.9, n = 11 pairs, p < 0.001). Moreover, when match data was binned pre- and post-ACMGE merger, there were significantly fewer DO positions filled post-merger for each highly competitive specialty, except orthopedic surgery. Conversely, diagnostic radiology, anesthesiology, and OB/GYN all reported a positive correlation of DO match rates with time (Radiology: Regression: y = 0.4x – 888.6; r2 = 0.6; Spearman’s: r = 0.7, n = 11 pairs, p = 0.01; Anesthesiology: Regression: y = 0.5x – 968.4; r2 = 0.4; Spearman’s: 0.6, n = 11 pairs, p = 0.0562; OB/GYN: Regression: y = 0.4x – 715.2; r2 = 0.6; Spearman’s: r = 0.8, n = 11 pairs, p = 0.004 ) and either a statistically significant increase in DO-filled positions (Radiology: U = 2, p = 0.01; OB/GYN: U = 3, p = 0.03) or a positive trend (Anesthesiology: U = 7, p = 0.2). Although a positive correlation was also observed with MD-filled positions and time, no significant increase pre- versus post-merger was observed (Radiology: U = 13, p = 0.8; Anesthesiology: U = 7, p = 0.2, OB/GYN: U = 12, p = 0.7). Conclusion: The ACGME merger generated variable impact on osteopathic representation in competitive specialties. While osteopathic graduate numbers have increased, their representation in competitive residencies has declined post-merger. Conversely, there was a significant increase in traditionally less competitive residency programs. Our study highlights the ongoing imparity between match rates for DO and MD graduates. Introduction The United States (US) is projected to experience a significant shortage of physicians (52,000 physicians) by 2025 and this deficit is predicted to grow (122,000 physician deficit by 2032).1 To combat this issue, the number of allopathic (MD) and osteopathic (DO) medical school enrollments has substantially increased over the last several years (DO: 2014: 7,012 students; 2022: 8,636 students; 23.2% increase; MD: 2015: 20,631 students; 2020: 22,239 students; 7.8% increase).2-5 As the growth of medical school training programs continues, the focus has shifted to the ability to provide quality residency and clinical training sites.6 For DO and MD graduates to find a residency position, they must apply through the “match” process. The National Resident Matching Program (NRMP) began in 1952 to ensure a fair and organized match process for medical school seniors and graduates.7 Participants apply to residency programs, interview, rank their preferred programs, and then await “Match Day” to learn where they would complete their training.8 Typically, both MD and DO students would seek a match to an preliminary internship or categorical residency program.9 However, some residency programs still require a transitional internship year before pursuing postgraduate year 2 (PGY-2) positions in specialties such as anesthesiology, radiology, dermatology, and ophthalmology.10 Prior to 2014, DO graduates wishing to pursue a specialty with a traditional rotating intern year in an American Osteopathic Association (AOA) accredited program would be, in many cases, ineligible for an Accreditation Council for Graduate Medical Education (ACGME) residency position.11-13 However in 2014, the ACGME merger was announced, allowing access of all accredited graduate medical education (GME) programs to both MD and DO graduates.14 While the ACGME merger aimed to standardize accreditation and foster equal opportunities for medical graduates, the effects on match rates for osteopathic graduates remain under investigation.15-17 Potential inequality in matching is not only an ethical issue but may further decrease already limited access to care in rural areas, as DO physicians have been more likely to practice in non-urban settings.18,19 The impact of the ACGME merger on DO graduates has been investigated over the years. For example, a recent study by Wood and Krumrey (2024) examined trends in the orthopedic surgery match for both osteopathic and allopathic medical graduates post-merger.16 Their findings revealed significantly lower match rates for DOs compared to MD (2018: DO: 23.5%, MD: 82.4%; 2022: DO: 56.3%, MD: 65.8%), highlighting the challenges and disparities faced by DO graduates in securing positions in competitive residency programs. Interestingly the authors proposed the lower rates of DO matches in 2018 compared to 2022 were due to incomplete adoption of the ACGME at that time. Also notable is the recent research by Lavertue and Terry (2023) as it provides valuable insights into the disparity faced by DO graduates by comparing surgical subspecialty match rates (Neurological surgery: DO: 37.5%, MD: 73.5%; Orthopedic surgery: DO: 54.2%, MD: 64.9%; otolaryngologic surgery: DO: 51.2%, MD:68.3%; plastic surgery: DO: 0.0%, MD: 61.6%; Surgery (Categorical): DO: 53.4%, MD: 72.2%; thoracic surgery: DO: 25.0%, MD: 54.0%; Vascular surgery: DO: 6.3%, MD: 72.0%) in the United States for the year 2022.20 These studies highlight that, despite the merger, notable differences in match outcomes between DO and MD graduates remain. These findings also suggest that DO graduates may still face unique challenges in securing positions within competitive surgical subspecialties and underscores the need for further investigation into how the single accreditation system affects the residency match outcomes for DO graduates across various specialties. The ACGME merger was not complete until 2020, therefore data collected prior to this point is a mixture of transitioned and non-transitioned GME programs, with fewer converted programs at time points closer to 2014. Hence, data analyzed from 2014–2019 can be considered as “pre-merger” time points. However, data collected in 2020 and later encompass all ACGME accredited programs and can be considered as “post-merger”. In this study, we analyzed match rates for DO and MD in both competitive and non-competitive specialties from 2014–2024 with subsequent analysis of differences observed pre- and post-merger. This study aims to provide insights into the impact of the unified accreditation system on the residency placement success of DO graduates and inform future policies and practices in medical education and residency training. Methods Publicly accessible data were collected from 2014–2024 from the National Resident Matching Program (NRMP), the National Matching Service (NMS), American Association of Colleges of Osteopathic Medicine (AACOM), and the Association of American Medical Colleges (AAMC). All data were analyzed by linear regression analysis, Spearman’s correlation, and Mann-Whitney U tests (C.B.D.) using Prism v10 (Graphpad Software, Boston, MA). This study was deemed exempt from review by the Lake Erie College of Osteopathic Pathic (LECOM) Institutional Review Bord (IRB) under protocol number 31-129. Results Over the past decade, osteopathic medical schools have expanded more rapidly than allopathic programs, resulting in a substantial increase in the proportional number of DO graduates. The number of graduating DO students steadily increased from 2014 (4,997 students) to 2023 (7,891 students). This increase (57.9%) is only partially mirrored by allopathic medical school graduation rates (2014: 18,072 students, 2023: 20,922 students, 15.8% increase; Fig. 1). Dermatology has historically been regarded as a highly competitive specialty.21 A linear regression analysis of dermatology match results from NRMP data ranging from 2014 – 2024 indicates a weak, negative correlation for DO graduates matching to dermatology residencies while a weak, positive correlation was observed for MD graduates in this field (DO: y = -0.2x + 464.0; r2 = 0.3; CI95slope = -0.5 to 0.1; MD: y = 0.3x – 490.3; r2 = 0.2; CI95slope = -0.1 to 0.7; Fig. 2A). Spearman r correlation analysis showed a moderate direct relationship for DO graduates, while results for MD graduates were non-significant (DO: r = -0.6, CI95: -0.9 to -0.01, n = 11 pairs, p < 0.05, MD: r = 0.5, CI95: -0.2 to 0.8, n = 11 pairs, p = 0.1; data not shown). To determine if graduates differed pre- and post-merger, match rate data from 2014 - 2019 and 2020 - 2024 were binned and compared with a Mann-Whitney U Test. There was a significant difference between the percent of DO graduates matching to dermatology programs pre- and post- merger (Pre: median = 11.5, n = 6; Post: median = 9.3, n = 5; U = 0, p < 0.01; Fig. 2B), indicating a decrease in the percentage of positions filled by DO graduates following the completion of the single accreditation merger. Interestingly, MD post-merger fill rates were significantly greater than pre-merger fill rates (Pre: median = 85.0, n = 6; Post: median = 87.4, n = 5; U = 3, p = 0.03; Fig. 2B). Neurosurgery, traditionally a highly competitive residency, historically offered fewer AOA-accredited residency positions.22 Linear regression analysis indicates a significant negative correlation for DO graduate matches while a significant, weak, positive correlation for MD graduates matching to neurosurgery residencies (DO: y = -0.6x + 1286; r2 = 0.8; CI95slope = -0.9 to -0.4; MD: y = 0.3x – 570.8; r2 = 0.2; CI95slope = -0.1 to 0.8; Fig. 2C). To further characterize the correlation between DO and MD programs and neurosurgery residency matches by year, a Spearman r correlation analysis was performed. Only DO graduates displayed a strong direct relationship (DO: r = -0.9, CI95: -1.0 to -0.6, n = 11 pairs, p < 0.001; MD: r = 0.4, CI95: -0.3 to 0.8, n = 11 pairs, p = 0.3; data not shown). Interestingly, although the percent of MD graduates matching to neurosurgery residencies was not significant by the Spearman’s analysis and only showed a weak correlation with the linear regression analysis, the total percentage of matches at the lowest point was 85.3% (2015) and reached 90.0% (2024), suggesting that levels of MD graduates matching to this specialty has always been great regardless of the year. A comparison of pre- and post-merger data indicated a significant decrease on post-merger positions filled for DOs but no significant difference for MD residency applicants (DO: Pre: median = 6.3, n = 6; Post: median = 1.7, n = 5; U = 0, p = 0.004; MD: Pre: median = 89.5, n = 6; Post: median = 90.0, n = 5; U = 12, p = 0.7; Fig. 2D). Orthopedic surgery is also a competitive residency but with a greater number of available residency positions each year as compared to other surgical specialties.23 Interestingly, neither a linear regression analysis nor Spearman’s correlation analysis indicated a significant correlation for either osteopathic or allopathic graduates in this field (Linear Regression: DO: y = 0.005x + 3.4; r2 = 0.001; CI95slope = -0.1 to 0.1; MD: y = 0.02x + 35.5; r2 = 0.02; CI95slope = -1.0 to 0.1; Fig. 2E; Spearman’s: DO: r = -0.009, CI95: -0.6 to 0.6, n = 11 pairs, p = 1.0; MD: r = 0.1, CI95: -0.6 to 0.7, n = 11 pairs, p = 0.8; data not shown). Additionally, comparison of pre-and post-merger rates for both DO and MD applicants were not significantly different (DO: Pre: median = 14.1, n = 6; Post: median = 14.0, n = 5; U = 9, p = 0.3; MD: Pre: median = 84.5, n = 6; Post: median = 84.7, n = 5; U = 10, p = 0.4; Fig. 2F). These data indicate that the ACGME merger has not significantly impacted either DO or MD acceptance rates to orthopedic surgery residencies. To determine if only the highest competitive residency programs demonstrate reduced DO fillings post-ACMGE merger, radiology, anesthesiology, and obstetrics-gynecology (OB/GYN) matches were also analyzed. Although not traditionally considered a highly competitive residency, the number of applicants seeking diagnostic radiology residency has increased over recent years.24 A linear regression analysis indicated a significant positive correlation for DO graduates and a trending positive correlation for MD graduates (DO: y = 0.4x – 888.6; r2 = 0.6; CI95slope = 0.2 to 0.7; MD: y = 0.3x – 528.8; r2 = 0.1; CI95slope = -0.3 to 0.9; Fig. 3A). A Spearman r correlation analysis confirmed a significant positive correlation for DO graduates but no correlation for MD graduates (DO: r = 0.7, p = 0.01, CI95slope = 0.2 to 0.9; MD: r = 0.3, p = 0.4, CI95slope = -0.4 to 0.8; data not shown). Comparison of pre- and post-merger fillings indicate a small but significant increase in DO fillings post-merger, but no significant change in post-merger fillings for MD applicants (DO: Pre: median = 12.2, n = 6; Post: median = 15.8, n = 5; U = 2, p = 0.02; MD: Pre: median = 73.5, n = 6; Post: median = 74.6, n = 5; U = 13, p = 0.8; Fig. 3B). Similar to radiology, anesthesiology residency programs have seen a surge in interest over the past several years, with a growing number of applicants.25,26 Linear regression analysis indicates a significant positive correlation for osteopathic graduates (DO: y = 0.5x – 915.4; r2 = 0.4; CI95slope = 0.07 to 0.9; Fig. 3C) but no significant correlation for allopathic graduates (MD: y = 0.1x – 178.7; r2 = 0.02; CI95slope = -0.5 to 0.7; Fig. 2C). A Spearman r correlation was nearly significant for DO graduates and non-significant for MD graduates (r = 0.6, CI95: -0.2 to 0.9, n = 11 pairs, p = 0.06; MD: r = 0.1, CI95: -0.5 to 0.7, n = 11 pairs, p = 0.8; data not shown). A trend to increase DO fillings was observed when comparing pre- and post-merger, but neither change in DO or MD fillings was significant between the two time points (DO: Pre: median = 15.1, n = 6; Post: median = 18.1, n = 5; U = 7, p = 0.2; MD: Pre: median = 70.2, n = 6; Post: median = 74.0, n = 5; U = 9, p = 0.3; Fig. 3D). OB/GYN residency programs uniquely blend surgical and medical care for women across the lifespan. Linear regression analysis of match data from categorical OB/GYN residencies indicate a significant positive correlation for osteopathic graduates (DO: y = 0.4x – 715.2; r2 = 0.6; CI95slope = 0.2 to 0.6; Fig. 3E) but no significant correlation for allopathic graduates (MD: y = 0.01x + 55.1; r2 = 0.0; CI95slope = -0.3 to 0.3; Fig. 3E). A Spearman r correlation was significant for DO graduates and non-significant for MD graduates (r = 0.8, CI95: 0.4 to 1.0, n = 11 pairs, p = 0.004; MD: r = 0.1, CI95: -0.6 to 0.7, n = 11 pairs, p = 0.8; data not shown). A significant increase in DO fillings was observed when comparing pre- and post-merger, however, MD fillings were not significantly different between the two time points (DO: Pre: median = 15.3, n = 6; Post: median = 16.9, n = 5; U = 3, p = 0.03; MD: Pre: median = 76.6, n = 6; Post: median = 77.4, n = 5; U = 12, p = 0.7; Fig. 3F). These data indicated that DO applications have fared better post-merger in traditionally less competitive residency programs. Discussion Our results indicate that DO match rates have significantly decreased for highly competitive dermatology and neurosurgery residencies after the finalization of the ACGME merger. Conversely, DO matches in radiology and OB/GYN have increased post-merger and a similar trend was observed for DO anesthesiology matches. Several factors may contribute to the decrease in match rates for DO graduates into competitive residencies. The single accreditation system may have increased competition for former AOA-accredited residency positions. For example 27.6% of MDs matched to former AOA programs previously filled by DOs.18 Additionally, DO schools have fewer associated home programs than MD schools and may not be able to provide away rotations, another positive predictor of match success.27,28 These factors provide a distinct advantage to many MD applicants. Research accomplishments are a positive predictor of match success and is regarded as an important factor of the resident selection process by many program directors.22,29 MD applicants who successfully matched had greater average number of research accomplishments than DO applicants30. This is not surprising as osteopathic universities have traditionally only received a small percentage of total National Institute of Health funding to medical schools.31 Moreover, osteopathic medical students report a substantial interest in research opportunities, however, many students (53.0%) also reported a lack of structured support in identifying and connecting with research faculty.32 Another factor that may contribute to the disparate DO and MD match rates is the recent shift from a graded United States Medical Licensing Examination (USMLE) Step 1 to pass/fail in 2022. Traditionally USMLE scores were a significant predictor of successful matches.33,34 Interestingly, now that USMLE Step 1 and COMLEX Level 1 exams do not provide scores, Step 2 exams have been speculated to hold more weight in the contemporary assessment of students.35 Additionally, DO students are required to take COMLEX exams, and are therefore well-prepared for COMLEX exams. However, taking USMLE exams is optional for DO students, which may result in less preparation for the USMLE exams. Consequently, if they choose to take the USMLE, they might score lower compared to their MD peers, potentially impacting their competitiveness in securing positions in competitive specialties. An additional factor that may skew parity in the match process is that the ACGME merger led to changes in accreditation standards that some osteopathic programs struggled to meet, reducing former AOA residency positions. Nine hundred and five AOA accredited GME programs existed in 2014, but as of 2020, only 560 former-AOA programs (out of 606 applicants) were accredited by the ACGME.13 The loss of osteopathic-centric GME with the single accreditation system (SAS), negatively affects DOs without a significant impact on MD applicants. For DO applicants interested in competitive specialties, proactive steps can be taken, such as seeking early mentorship in the desired field and pursuing research opportunities, especially during the preclinical years of medical school. DO students may choose to take allopathic board exams to enable a more direct comparison with MD applicants. Osteopathic schools could enhance mentorship opportunities by hiring faculty from competitive specialties in addition to primary care faculty and provide more robust guidance and board preparation material for students preparing for allopathic board exams. From the perspective of residency programs, adopting a more integrated approach during applicant interviews and ranking could also help mitigate disparities between DO and MD applicants. Limitations The difference in pre- and post-merger data is inherently confounded by the lack of clarity in what percentage of programs had already adapted to the SAS between 2014 and 2019. However, this confound would reduce our ability to infer a difference as the post-merger data is comprised of only SAS programs. Therefore, the differences described in this study are more likely to underreport the difference between pre- and post-merger discrepancies for DO and MD graduates. Moreover, the study's focus on match rates may introduce selection bias, as it does not explicitly consider other factors influencing residency placement, such as candidate qualifications, program preferences, and interview performance. Additionally, the analysis may be confounded by external factors beyond our study's scope, including changes in medical school admissions policies, shifts in healthcare workforce demand, and economic variables affecting residency program funding and availability. Addressing these limitations in future research endeavors could provide valuable insights informing policy and practice within medical education and residency training. Conclusions The transition to a SAS aimed to standardize the residency match process for both MD and DO graduates. Some desirable residency programs such as radiology and OB/GYN have seen an increase in DO applicants and fillings. However, the data suggests that the merger has not equalized all opportunities, particularly in highly competitive specialties such as dermatology and neurosurgery. DO graduates continue to face challenges in securing positions within these specialties, due to structural and institutional factors such as lack of research funding. The persistent disparities in match outcomes underscores the need for interventions. Osteopathic medical schools and organizations should enhance mentorship programs, increase research opportunities, and provide comprehensive support for students preparing for both COMLEX and USMLE exams. By addressing the challenges and implementing solutions, the medical education community can move towards a more equitable residency match process, thereby advancing the principles of the osteopathic philosophy. References 1. Petterson SM, Liaw WR, Phillips RL, Rabin DL, Meyers DS, Bazemore AW. Projecting US primary care physician workforce needs: 2010-2025. The Annals of Family Medicine. 2012;10(6):503-509. 2. Guercio E. 2022 AACOMAS Applicant & Matriculant Profile Summary Report. 2024:28. Research Reports. May 28th, 2024. 3. Ali A. Applications, Enrollment and Graduates by Osteopathic Medical College 2014-2019. 2019:1. Research Reports. August 22, 2019. 4. Orlowski J, Dill M, Fisher K. Results of the 2018 Medical School Enrollment Survey. Association of American Medical Colleges. 2018; 5. Whatley M, Jones K, Orlowski J. Results of the 2015 Medical School Enrollment Survey. 2016:23. April 2016. https://www.aamc.org/data-reports 6. Medical school enrollments grow, but residency slots haven’t kept pace. AAMC; Sept. 3, 2020, 2020. https://www.aamc.org/news/medical-school-enrollments-grow-residency-slots-haven-t-kept-pace 7. Roth AE. The origins, history, and design of the resident match. Jama. 2003;289(7):909-912. 8. Holmstrom A. National Resident Matching Program (NRMP). The American Health Care System: A Practical Guide for Foreign Medical Graduates Who Want to Enter the System. 2018:21-31. 9. NMRP. National Resident Matching Program, Results and Data: 2021 Main Residency Match. 2021:128. May 2021. Accessed 07/12/2024. https://www.nrmp.org/match-data-analytics/residency-data-reports/ 10. Pfeifer CM. Evolution of the preliminary clinical year and the case for a categorical diagnostic radiology residency. Journal of the American College of Radiology. 2016;13(7):842-848. 11. Buser BR. A single graduate medical education accreditation system: ensuring quality training for physicians and improved health care for the public. Journal of Osteopathic Medicine. 2014;114(4):231-232. 12. Burkhart DN, Lischka TA. Osteopathic graduate medical education. Journal of Osteopathic Medicine. 2008;108(3):127-137. 13. Cummings M. The single accreditation system: risks to the osteopathic profession. Academic Medicine. 2021;96(8):1108-1114. 14. AOA, ACGME and AACOM usher in new era of single accreditation for graduate medical education. 07/11/2024. Accessed 07/11/2024. https://osteopathic.org/. 15. Kortz MW, Vegas A, Moore SP, et al. National resident matching program performance among US MD and DO seniors in the early single accreditation graduate medical education era. Cureus. 2021;13(8) 16. Wood RS, Krumrey J. Examining differences in trends in the orthopedic surgery match for osteopathic and allopathic medical graduates after the transition to single accreditation. Journal of Osteopathic Medicine. 2024;(0) 17. Sees JP, Nahian A, Johnson R. A 10-Year Report on the Trends of Osteopathic Medical Students (OMS) in Osteopathic Orthopaedic Residency over the Past Decade. Journal of the American Osteopathic Academy Orthopedics. 2023;7(1) 18. Craig E, Brotzman E, Farthing B, Giesey R, Lloyd J. Poor match rates of osteopathic applicants into ACGME dermatology and other competitive specialties. J Osteopath Med. Mar 1 2021;121(3):281-286. doi:10.1515/jom-2020-0202 19. Santavicca S, Willis MH, Friedberg EB, Hughes DR, Duszak R, Jr. Osteopathic Versus Allopathic Radiologist Workforce Characteristics: A Medicare Administrative and Claims Data Analysis. J Am Coll Radiol. Sep 2022;19(9):997-1005. doi:10.1016/j.jacr.2022.06.004 20. Lavertue SM, Terry R. A comparison of surgical subspecialty match rates in 2022 in the United States. Cureus. 2023;15(4) 21. Korman AM, Grant-Kels JM. Applying to dermatology residency: An ethical approach to an inherently unethical process. Int J Womens Dermatol. Sep 2018;4(3):176-178. doi:10.1016/j.ijwd.2018.01.001 22. Yaeger KA, Schupper AJ, Gilligan JT, Germano IM. Making a match: trends in the application, interview, and ranking process for the neurological surgery residency programs. Journal of Neurosurgery. 2021;135(6):1882-1888. 23. Chen AF, Secrist ES, Scannell BP, Patt JC. Matching in orthopaedic surgery. JAAOS-Journal of the American Academy of Orthopaedic Surgeons. 2020;28(4):135-144. 24. Rafiee F, Hosseiny M, Firouzabadi FD, Yousem DM. 2018-2022 Radiology Residency and Neuroradiology Fellowship Match Data: Preferences and Success Rates of Applicants. AJNR Am J Neuroradiol. Aug 2022;43(8):E15-E16. doi:10.3174/ajnr.A7565 25. Rock-Klotz JA, Miller TR. 2022 Anesthesiology residency matches hit another record. ASA Monitor. 2022;86(8):30-31. 26. Rock-Klotz JA, Miller TR. Revival of reporting anesthesiology residency trends. ASA Monitor. 2018;82(8):42-46. 27. Nasser JS, Artino AR, Jr., Kind T, Duan X, Mihalic AP, Chretien K. Matching into competitive surgical residencies: predictors of success. Med Educ Online. Dec 2023;28(1):2189558. doi:10.1080/10872981.2023.2189558 28. Nestler AJ, Feibel BM, Beason AM, et al. The student you know: orthopedic surgery home program match rates and geographic relationships before and after COVID-19. Journal of Surgical Education. 2023;80(3):476-482. 29. Melendez MM, Xu X, Sexton TR, Shapiro MJ, Mohan EP. The importance of basic science and clinical research as a selection criterion for general surgery residency programs. Journal of surgical education. 2008;65(2):151-154. 30. Matthews CN, Estrada DC, George-Weinstein M, Claeson KM, Roberts MB. Evaluating the influence of research on match success for osteopathic and allopathic applicants to residency programs. Journal of Osteopathic Medicine. 2019;119(9):588-596. 31. Suminski RR, Hendrix D, May LE, Wasserman JA, Guillory VJ. Bibliometric measures and National Institutes of Health funding at colleges of osteopathic medicine, 2006-2010. Journal of Osteopathic Medicine. 2012;112(11):716-724. 32. Ho A, Auerbach A, Faulkner JJ, Guru SK, Lee A, Manna D. Barriers to research opportunities among osteopathic medical students. Journal of Osteopathic Medicine. 2023;123(4):187-194. 33. Rinard JR, Garol BD, Shenoy AB, Mahabir RC. Successfully matching into surgical specialties: an analysis of national resident matching program data. Journal of graduate medical education. 2010;2(3):316-321. 34. Stone CL, Dogbey GY, Falls J, Kuo Y-P. Key factors for residency interview selection from the National Resident Matching Program: analysis of residency Program Director surveys, 2016–2020. Journal of osteopathic medicine. 2023;123(11):523-530. 35. Yu N, Hoch JS, Martin AR, Shahlaie K. Trends in successfully matched neurosurgery residency applicants. Journal of Neurosurgery. 2023;139(5):1456-1462. Table 1. Osteopathic and Allopathic Residency Positions Filled Pre-ACMG Merger
Table 2. Osteopathic and Allopathic Residency Positions Filled Post-ACMG Merger
Figure 1. DO and MD Graduation Rates by Year
Figure 2. DO and MD Highly Competitive Residency Matches by Specialty
Figure 3. DO and MD Moderately Competitive Residency Matches by Specialty |

Pennsylvania Osteopathic Medical Association
© Copyright 2026 Pennsylvania Osteopathic Medical Association1330 Eisenhower Boulevard | Harrisburg, PA 17111-2395
P: (717) 939-9318 | F: (717) 939-7255 | [email protected]
Privacy Policy